

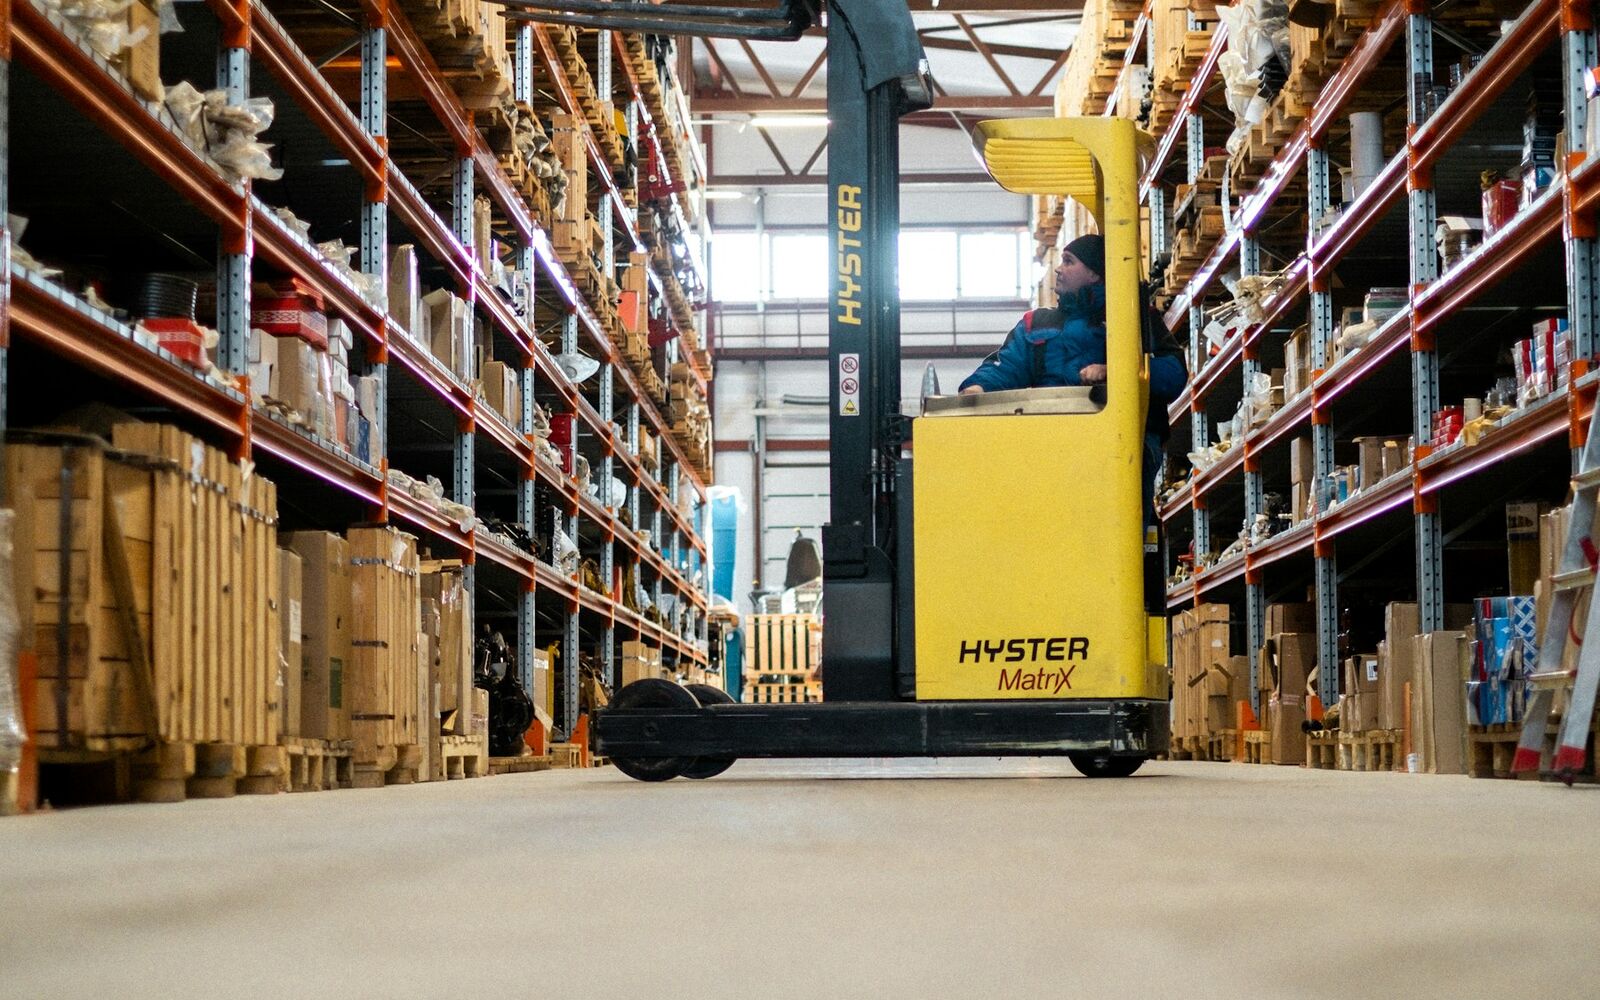
Too much stock ties up capital on the shelf; too little loses sales. Finding the balance between those two extremes is one of the oldest and most critical problems in logistics. Inventory management in logistics is not just knowing how many units are in the warehouse; it is planning which product needs to be where, when and in what quantity, and matching that plan to the supply and distribution flow. Done well, it eases cash flow, lowers storage costs and lifts delivery performance. This article covers inventory management logistics from the ground up: core concepts, methods, the KPIs worth tracking and the mistakes to avoid. Özd Global tracks customers' stock on its WMS at the Gebze warehousing and distribution centre and integrates it with the distribution plan.

Why Inventory Sits at the Heart of Logistics
Stock exists in a different form at every link of the supply chain: raw material at the supplier, work in progress in production, finished goods in the warehouse, cargo in transit, shelf stock in the store. Logistics is the sum of the movements that put that stock in the right place at the right time, so inventory decisions cannot be separated from transport and warehousing:
- Larger order quantities lower the unit transport cost but raise storage cost.
- More frequent, smaller shipments reduce stock but increase transport spend.
- Longer lead times call for more safety stock.
Inventory management logistics is a search for the balance that optimises total cost; it is not merely a bookkeeping exercise inside the warehouse.
Core Concepts
Safety Stock
The buffer held against demand fluctuations and supply delays. The longer the lead time and the more variable the demand, the larger the safety stock.
Reorder Point
The stock level at which a new order is placed, usually calculated as expected consumption during the lead time plus safety stock.
Inventory Turnover
How many times stock is sold and replenished in a period. High turnover signals efficient use of capital, although excessively high turnover raises the risk of stock-outs.
Carrying Cost
The total of storage, insurance, cost of capital, spoilage and obsolescence, usually expressed as an annual percentage of inventory value and varying widely by industry.
Inventory Management Methods
| Method | Core principle | Best suited to |
|---|---|---|
| ABC analysis | Products are grouped into A, B and C classes by value and volume; class A is tightly controlled | Businesses managing many SKUs |
| FIFO / FEFO | First in or first to expire goes out first | Food, pharmaceuticals, cosmetics |
| Just-in-time (JIT) | Stock kept at a minimum, supply arrives when needed | Reliable suppliers and steady demand |
| Min-max | A lower and upper stock level is defined for each product | Standard, predictable products |
| Consignment stock | Stock belongs to the supplier and is invoiced on use | High-value spare parts and consumables |
| Cycle counting | Stock is counted in sections throughout the year | Any warehouse disrupted by year-end counts |
Most businesses combine several methods: ABC analysis for prioritisation, min-max levels for class A items, and cycle counting to verify the whole inventory.

Performance Indicators to Track
To measure inventory management logistics performance, monitor these indicators regularly:
- Stock accuracy: How closely system records match physical counts.
- Stock-out rate: The percentage of orders where the product was unavailable when demanded.
- Inventory turnover: Sales in the period divided by average stock.
- Days in inventory: The average number of days a product spends between receipt and dispatch.
- Dead stock ratio: The share of total inventory that has not moved for a defined period.
- Order fill rate: The percentage of orders delivered complete and on time.
When these indicators are reported automatically from the WMS, management decisions become data-driven. In the Özd Global warehousing and distribution service, these reports are available in real time through the customer portal.
Tip: Review dead stock every quarter. For items that have not moved in six months, do not delay the decision to discount, bundle, return to the supplier or write off; these products not only occupy rack space but are also the biggest source of counting errors.
Integrating Inventory and Transport Planning
Stock-level decisions and shipment plans belong on the same table. Replacing weekly groupage with a full truckload every two weeks, for example, lowers transport cost but raises average stock. To strike the balance:
- Calculate reorder points with real lead times; transit times differ between road freight and sea freight.
- For imported goods, add customs processing time to the lead time; a bonded warehouse adds stock flexibility.
- Plan seasonal stock build-ups together with transport capacity.
- Share stock data with suppliers and customers; greater visibility reduces the need for safety stock.
Common Mistakes
- Applying the same stock policy to every product (skipping ABC prioritisation)
- Estimating lead times optimistically and keeping safety stock too low
- Trusting system records without physical counts
- Carrying dead stock on the balance sheet year after year
- Basing demand forecasts purely on past sales and ignoring campaign and seasonal effects
- Keeping stock data siloed between sales, purchasing and logistics teams
Most of these mistakes can be prevented with the right system and regular review. To assess your stock and distribution set-up with Özd Global, reach us via our contact page or call +90 551 462 41 34.
Frequently Asked Questions
How much safety stock should I hold? There is no single right number. It is calculated from demand variability, lead time and your target service level. Critical items warrant more, easily sourced items less, and the figure should be refreshed regularly.
What software do I need for inventory management? A WMS for in-warehouse movements and an ERP for purchasing and finance are sufficient. If you outsource warehousing, you can access the provider's WMS through a portal and get inventory management logistics reports without investing in your own software.
Does outsourced warehousing make stock control harder? Quite the opposite: a barcode-driven, WMS-based provider usually improves stock accuracy. What matters is real-time reporting and regular cycle counting.
Inventory management is a balancing act that shapes your logistics costs and your customer satisfaction at the same time. At our Gebze centre, Özd Global tracks your stock on a WMS and manages it in step with your distribution plan; share your inventory structure with us and let us build the right stock and distribution model together.